This was a ten-day project.
After deep investigations we realized a deep learning RNN model that forecast floods using given points of two rivers in the Metropolitan Region of Santiago, Chile. To be more specific we choose to use the LSTM architecture in order to treat the Time Series.
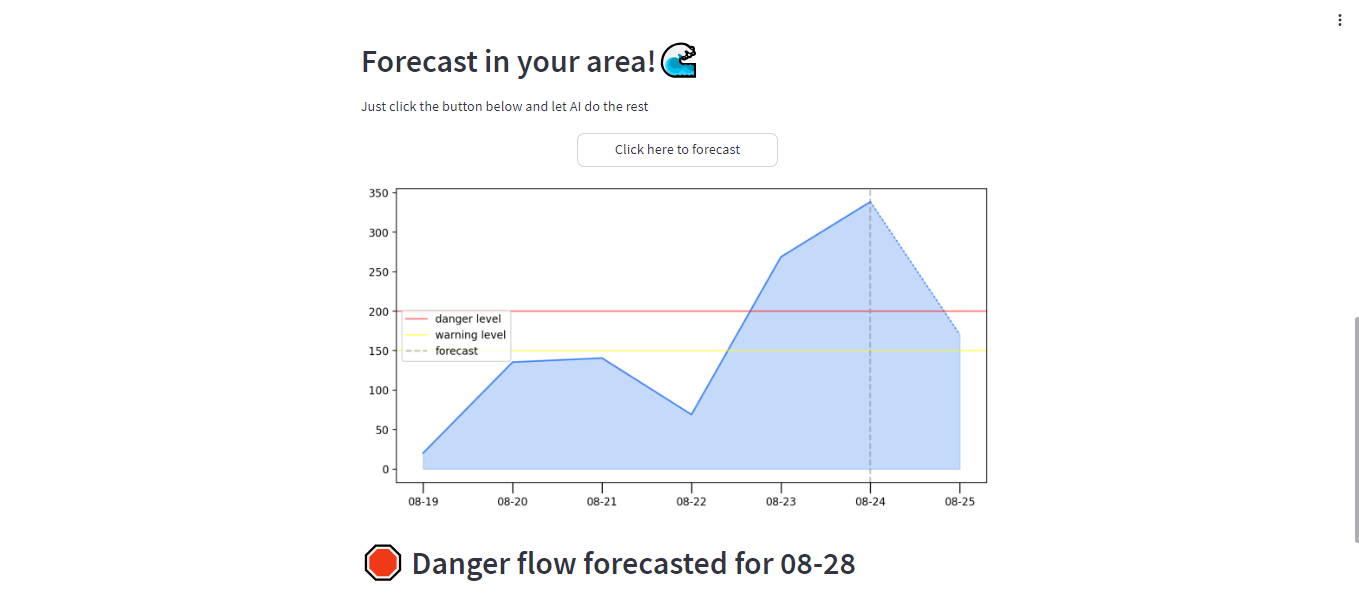
The model tells us the river discharge or flow values for the next 24 hours, indicating whether it is a level that should be considered a warning level or a flooding level. All this was visualized with a Matplotlib in order to be more intuitive for everyone.
The best way to obtain great data based on the time we had and getting quality information was this API that we found. And what data have we used to train the model? Almost 40 years of historical information!
After carefully investigating which are the most significant parameters that could or usually make an inference on river flow, we decided to use the following data from the API: temperature, precipitation, surface pressure, shortwave radiation, wind speed, wind direction, soil moisture, and of course, river flow.
Before getting hands-on model training, we had to do some Feature Engineering in order to convert non-cyclical features into cyclical features. In this way, we have relationships between features that are related to each other in real life but not in the data.
A real example for this case are the months; with a simple investigation we figured out that the most related months in the history of floods in this particular region in Chile are June, July and August.
On the other hand we have the features of the wind. Specifically wind speed and direction. And, what about these two features? Wind direction is measured in degrees and that means we are going to have artificial discontinuities, a problem that arises when the features have real numbers in wind direction.
For example: we have two data entries, the first is 359 degrees and the second is 1 degree. To the machine it looks like a drastic change, but in reality it is a very small turn.
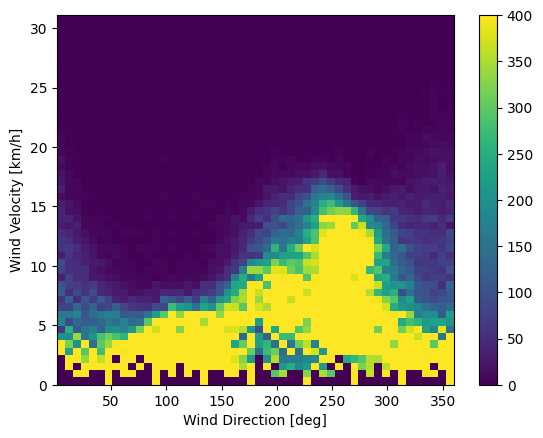
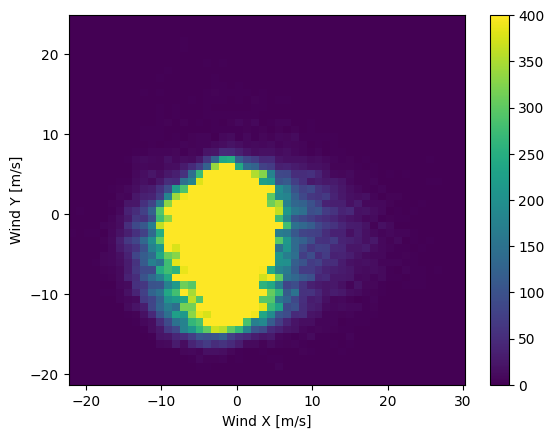
So, the transformation for cyclican variables avoids this kind of discontinuities. I leave here two images to make it more visualizable for everybody to see how the wind speed and wind direction was related before Feature Engineering and how they are after.
So, let’s move forward to Model time. We used an LSTM (Long short-term memory) as an alternative to deal with the vanishing gradient problem who’s present in traditional RNNs.
Why use an LSTM network to forecasts floods?
•These types of networks can handle long-term dependencies, which is very important for river time series, since relationships between data over time could extend over several periods.
•They are able to capture seasonal and cyclical patterns in the data (just what we are looking for).
•Have short- and long-term memory, as future values sometimes have dependencies on past events on different time scales.
Something else that everyone needs when modeling for Flood Forecasting is: Use Nash-Sutcliffe Efficiency. This metric (known as NSE) evaluates the ability of a Deep Learning model to predict Time Series. The closer the NSE value is to 1, the better the predictive ability of the model is, and the closer the value is to 0 or less, the worse the performance of the model is.
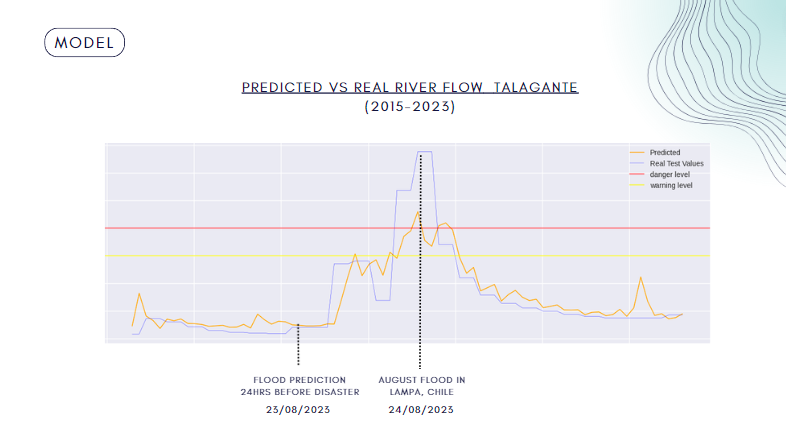
Coming to the end, I leave you some images showing the performance of the model to forecast river overflows.
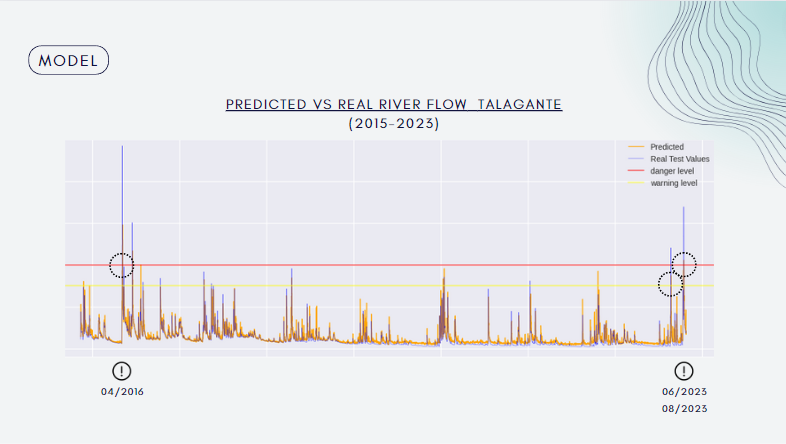 In these image we can see the performance of the model between the years 2015 and 2023 (completely unknown period for the forecast model).
In the three cases of overflows that occurred in the Metropolitan Region in Chile during that period of years, the model had a 100% accuracy performance, ruling those dates as a warning.
In two of the three cases it predicted danger (overflow). And in the remaining case as river levels are in warning.
And this is the end :)
Thanks everyone for reading ❤.
